What share of ESI funding did Member States dedicate to CLLD in 2014-20 and how does this differ by Fund?
This analysis is part of the CLLD in Europe initiative of LDnet, comprising CLLD country profiles and horizontal analyses (see here).
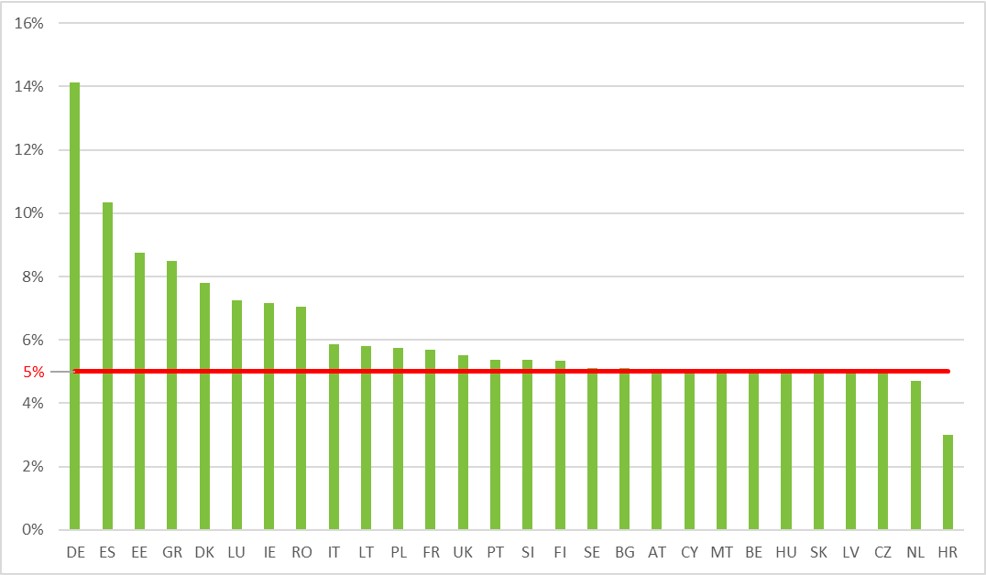
CLLD continues to be dominated by the EAFRD, which contributes three quarters of the overall CLLD funding (see here). This dominance is mainly due to the obligatory minimum LEADER allocation of 5%. Figure 1 shows that although the majority of countries does not go significantly beyond 5% of EAFRD, some opted to go well beyond these requirements. The highest shares of CLLD (LEADER) can be found in Germany (14.1%) and Spain (10.4%), which dedicate more than twice the required amount. Also others, such as Estonia (8.7%), Greece (8.5%) or Denmark (7.8%), decided to allocate comparably high shares of their EAFRD envelopes to LEADER.
Figure 1: Share of CLLD (LEADER) allocation of EAFRD by country, 2014-20
Source: ESI Funds Open Data Platform and programming documents. Most recent available data.
During the preparations for the 2021-27 programme period, there have been claims, especially by rural actors, that the minimum compulsory allocation for CLLD (LEADER) in the case of the EAFRD should also be in place for the other eligible ESI Funds. These minimum shares could, for instance, mirror those of the EAFRD, i.e. amounting to at least 5% of EMFF, ERDF and ESF. The European LEADER Association for Rural Development (ELARD) even argued for a minimum of 15% from each of the four Funds in its 2017 position paper on the future of CLLD/LEADER (see here).
In the light of these demands for not only more funding, but especially for funding coming from a wider range of sources, it is useful to take a closer look at the situation in the present 2014-20 programme period. What share of funding does each Member State currently dedicate to CLLD and how does this differ by Fund? Are there cases where the share of other Funds is already comparable to the one in EAFRD? Is there a chance of an obligatory minimum in other funds except EAFRD?
Figures 2-4 illustrate the current CLLD share for each of the three Funds EMFF, ERDF and ESF. However, it has to be kept in mind that these shares might differ significantly in those countries with regionalised ESIF implementation (e.g. Austria and Poland). While some regional programmes are making intense use of their funding for CLLD, others instead are not using certain Funds at all, thereby lowering the overall percentage of their country presented in the diagrams.
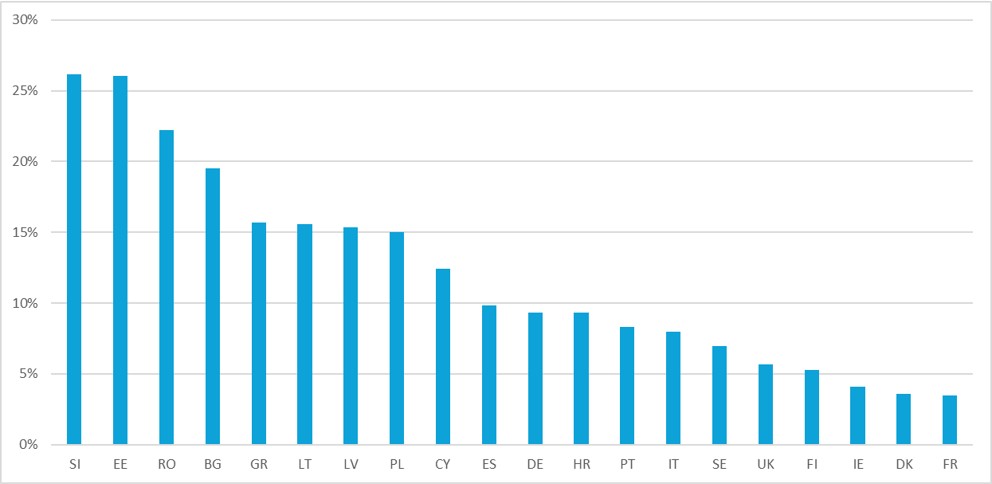
Figure 2: Share of CLLD allocation of EMFF by country, 2014-20
Source: ESI Funds Open Data Platform and programming documents. Most recent available data.
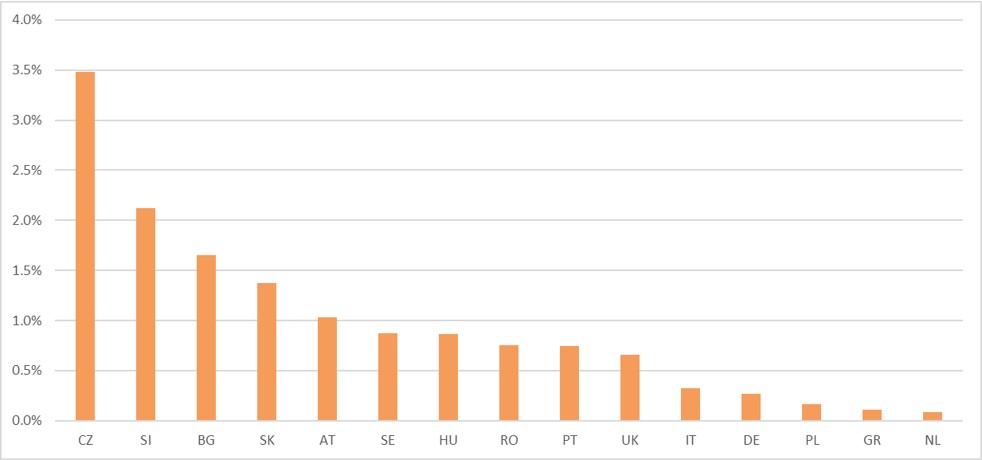
Figure 3: Share of CLLD allocation of ERDF by country, 2014-20
Source: ESI Funds Open Data Platform and programming documents. Most recent available data.
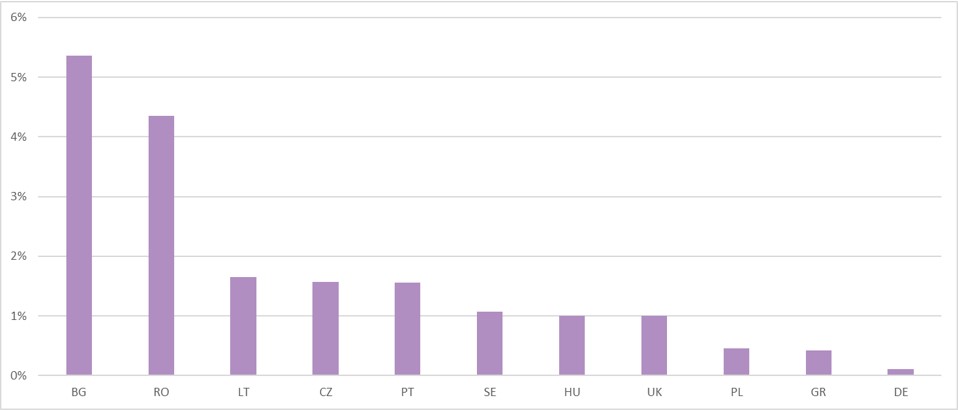
Figure 4: Share of CLLD allocation of ESF by country, 2014-20
Source: ESI Funds Open Data Platform and programming documents. Most recent available data.
The diagrams show that, with the exception of the EMFF, shares of ESI funding for CLLD are well below 5% in most Member States. The EMFF stands out (Figure 2), dedicating almost 10% of all its funds to CLLD. Most of the 20 Member States that are funding Fisheries Local Action Groups (FLAGs) invest over 5% of their EMFF allocation, with two countries (Slovenia and Estonia) channelling over a quarter of it through CLLD.
However, the use of Structural Funds, i.e. ERDF and ESF, for CLLD is relatively limited. This is the case not only in terms of the number of Member States using ERDF (15) and ESF (11), but also in terms of the share of these Funds dedicated to CLLD. Overall, just 0.6% of ERDF and 0.8% of ESF funding go to CLLD. This is also illustrated in Figures 3 and 4. The CLLD share of ERDF remains usually below 2%, with only Czechia (3.5%) and Slovenia (2.1%) going beyond. The CLLD shares of the ESF are not significantly higher, but two countries, Bulgaria (5.4%) and Romania (4.4%), are standing out.
Moving beyond the individual Funds, it is worth taking a look at the cumulative CLLD share of all four eligible ESI Funds. Figure 5 shows a scatter plot presenting not only the CLLD share in percentages, but also the absolute available funding in Euros.
Figure 5: Total CLLD funding (€) vs. CLLD share of eligible ESI funding by country, 2014-20
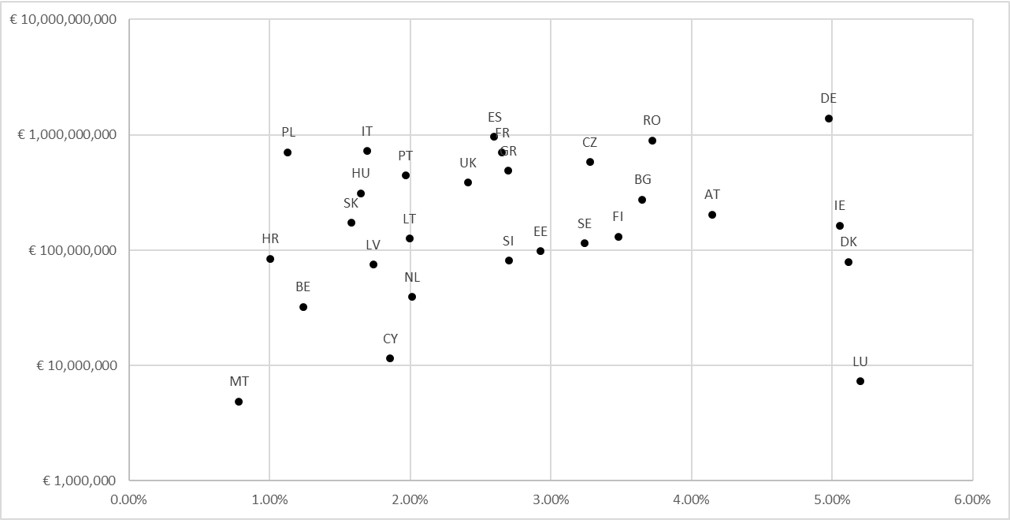
Note: a logarithmic scale is used on the y-axis. Source: ESI Funds Open Data Platform and programming documents. Most recent available data.
The overall share of CLLD by Member State is relatively evenly spread between 0.8% in Malta and 5.2% in Luxembourg. Yet, four countries stand out in terms of their CLLD share of funding: together with Luxembourg, Denmark (5.1%), Ireland (5.1%) and Germany (just under 5%) are also sitting approximately at the minimum allocation of 5% currently in place for the EAFRD and LEADER. However, these figures are strongly skewed by the relative role of the EAFRD, which amounts to over 90% of all CLLD funding in those four countries. The over-representation of the EAFRD is particularly visible in the case of Germany, which also has the highest allocation to CLLD in absolute terms (€1.39 billion), but this is mostly due to its very high share of LEADER funding (14.1%) shown in Figure 1.
This brief analysis of current allocation patterns to CLLD has shown a very diverse picture, but one that is still dominated by the only compulsory element of CLLD support: the 5% minimum allocation to LEADER. In the case of the EMFF, the shares are very high in several countries, but this has only a limited effect in absolute terms. Where these Funds are used at all, CLLD shares in ERDF and ESF are usually low. Still, there are a few cases where they represent a sizeable share, such as the ERDF in Czechia or the ESF in Bulgaria.
European Policies Research Centre
January 2021
Leave a Reply
You must be logged in to post a comment.