The 2014-20 programme period introduced the option for Member States to support Local Action Groups (LAGs) from more than just EAFRD or EMFF, allowing to also use the Structural Funds ERDF and ESF. Yet, only 16 Member States decided to make the use of Structural Funds for CLLD possible. For more detail please see the LDnet article Implementing cohesion policy funds through multi-Fund CLLD and a background paper – see here.
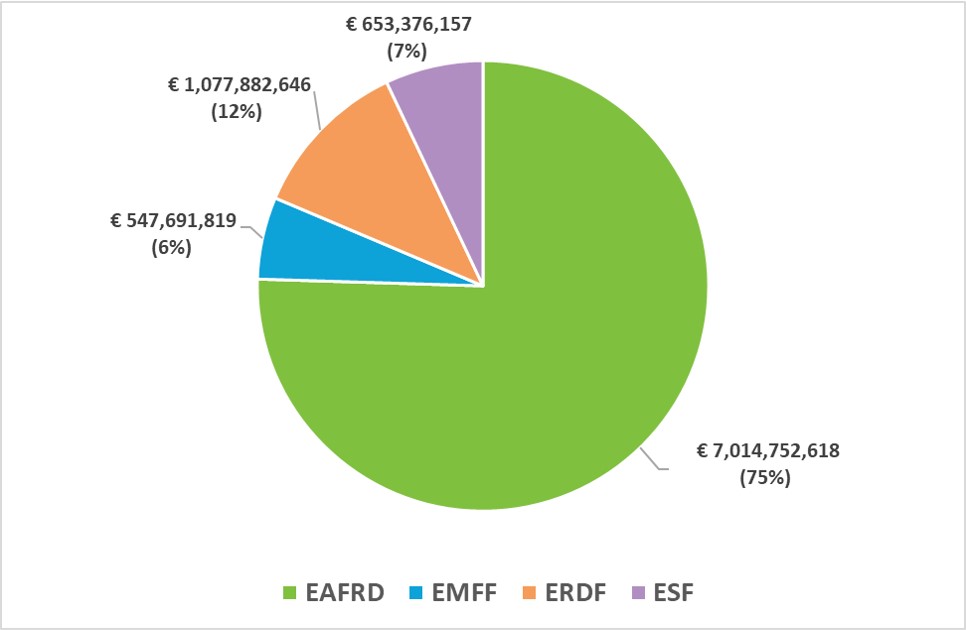
As the overview of funding sources (figure 1) shows, LAGs continue to be predominantly funded by EU rural funds. In 2014-20, the EU27 and the UK are implementing just under €9.3 billion of ESI funding through CLLD. However, the vast majority – three quarters or €7 billion – is coming from the EAFRD (see figure 1). Also, it is often delivered in a traditional mono-Fund way, continuing the long-established LEADER approach. The EMFF represents another 6% (€548 million) of the whole CLLD funding, leaving only the remaining 19% to the two Cohesion Policy Funds: the ERDF contributes 12% (€1,078 million) and the ESF 7% (€653 million).
Figure 1: EU sources of CLLD (LAGs budgets)

Source: ESI Funds Open Data Platform and programming documents
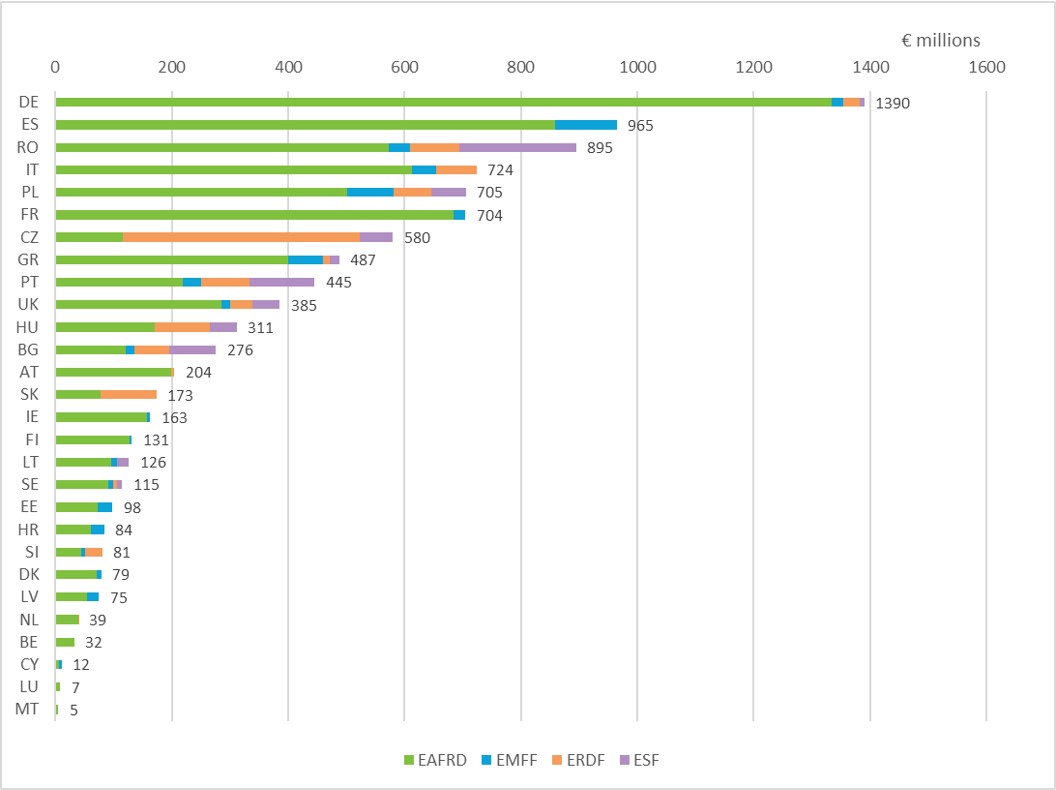
Most of those 16 Member States that make use of the option to add Cohesion Policy to the mix, allow this for both ERDF and ESF. Yet, in several countries (Austria, Italy, Netherlands, Slovakia and Slovenia) LAGs can only make use of ERDF funding, while Lithuania decided to allow LAGs to use ESF funding, but not ERDF. Figure 2 shows how much each of the four ESI Funds is contributing to the CLLD allocation in each country.
Figure 2: CLLD allocation by ESI Fund in each country (€)

Source: ESI Funds Open Data Platform and programming documents
The country-level overview confirms the dominance of rural funding for CLLD, as the EAFRD is the most important ESI Fund in all but two Member States (Czechia and Slovakia). Yet, in some countries, the funding coming from Structural Funds – ERDF and/or ESF – is larger than rural and fisheries funding. This is the case in Czechia (80.1%), Slovakia (55%) and Bulgaria (50.4%), but also in Hungary (44.9%), Portugal (43.6%) and Slovenia (37.1%) the contribution of Cohesion Policy is sizeable.
This raises a number of interesting questions, for instance if the figures are broken down to the average available budget for each individual LAG in different countries. Another interesting angle could be to put the budget into relation to the size of the population living in LAG territories. Over the next months, we will not only make new country profiles available, but there will also be further analyses investigating the available data.
European Policies Research Centre
November 2020
This analysis is part of the CLLD in Europe initiative of LDnet, comprising CLLD country profiles and horizontal analyses (see here).
Leave a Reply
You must be logged in to post a comment.