How does the average ESI funding per Local Action Group (LAG) compare by Member State?
This analysis is part of the CLLD in Europe initiative of LDnet, comprising CLLD country profiles and horizontal analyses (see here).
We have seen that the EAFRD is the dominant ESI Fund in most EU Member States (see here), but also that the shares of the various Funds that are dedicated to CLLD vary significantly by country.
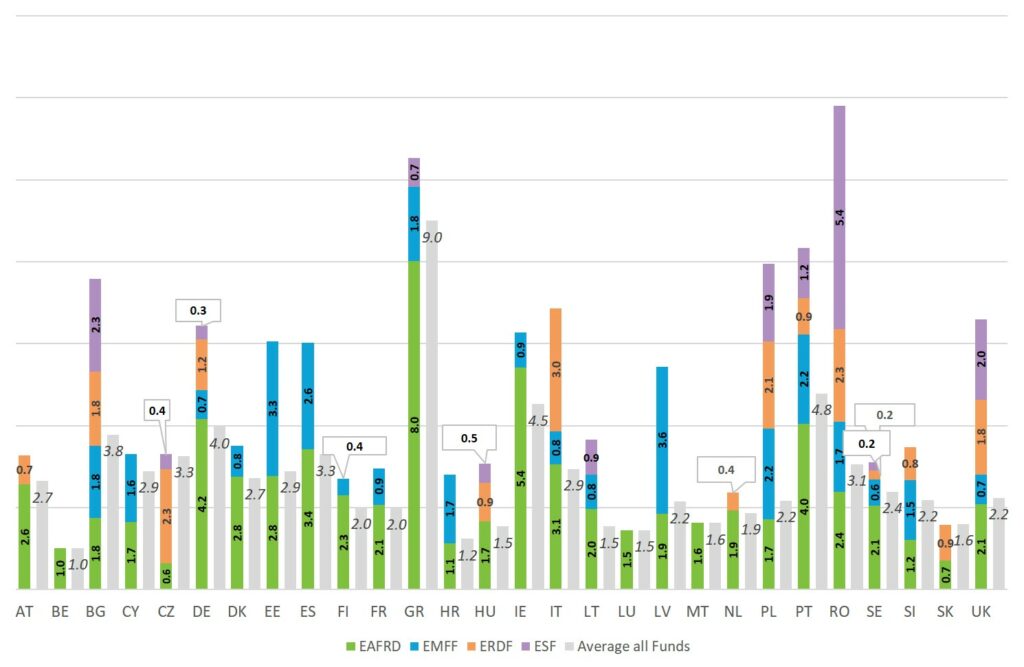
However, looking at the average amounts of funding available to each LAG provides another interesting perspective on EU-wide funding patterns. Figure 1 shows the average ESI Fund budget per LAG in 2014-20 (in grey), but also the average funding per LAG coming from each Fund – in those cases in which the LAG makes use of this Fund (in different colours).
Figure 1: Average ESI Fund budget per LAG 2014-20, in € by Member State
 Source: ESI Funds Open Data Platform and programming documents. Most recent available data. Greek data is under review.
What we can see from the grey columns, is that across the EU, the average amount of funding available to a hypothetical LAG under the assumption of multi-funding is €2.8 million. This average budget consists of c. €2.1 million of EAFRD, €322,000 of ERDF, €197,000 of ESF and €165,000 of EMFF funding. The smallest average budget can be found in Belgium with just €1 million, which is also one of only three countries that exclusively make use of EAFRD funding. The other two are Luxembourg and Malta, which are also among those countries with the lowest budgets. In the vast majority of countries, the average LAG budget sits between €1 million and roughly €3 million. Only a handful of countries go significantly beyond this, with Greece (€9 million), Bulgaria (€3.8 million), Germany (€4 million), Ireland (€4.5 million) and Portugal (€4.8 million) showing the highest average budgets in the EU. The diagram also illustrates that the relative importance of Funds, other than the EAFRD, can be significant:
- The ESF plays a very strong role for Portuguese, Bulgarian and Romanian LAGs.
- The EMFF is particularly important in Cyprus, Estonia and Latvia.
- Finally, the ERDF is a major source of funding in Slovakia, Slovenia and especially in Czechia, where it is the by far dominant component of the average LAG budget. Interestingly, the corresponding average Czech EAFRD budget is the lowest in the whole of the EU.
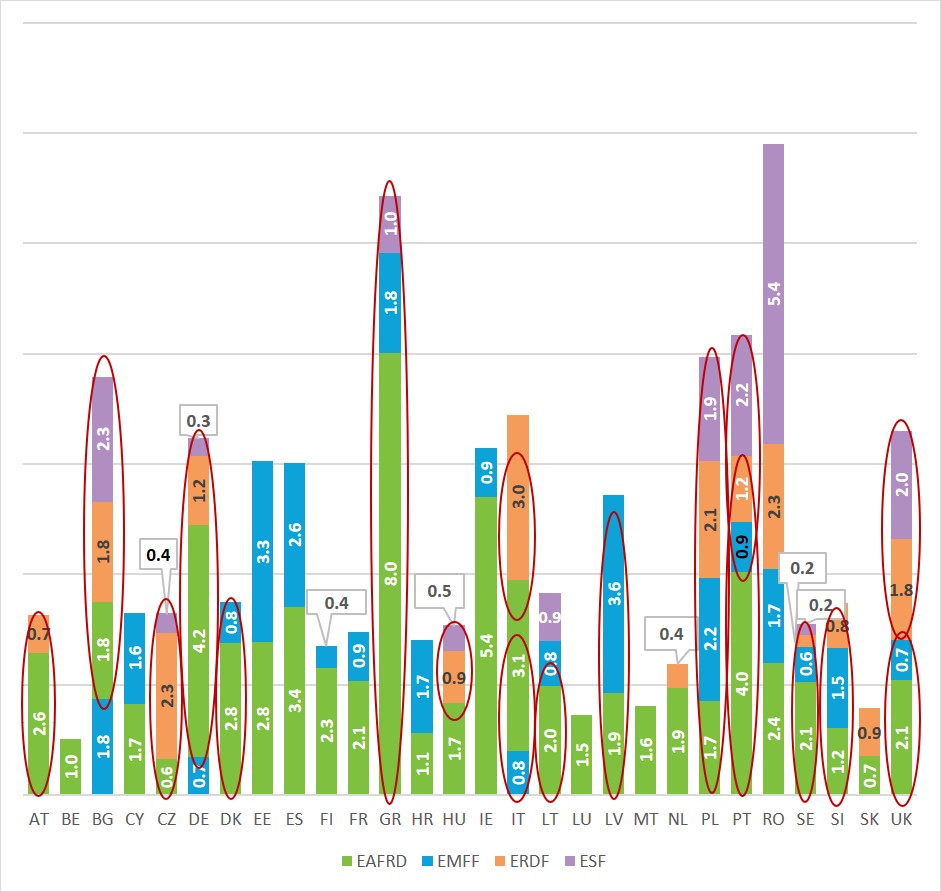
However, multi-funding arrangements vary widely throughout the EU. This is illustrated by the stacked columns in Figure 1, which show the average amount available per LAG using funding from each of the ESI Funds. But we need to take also into account the fact that in some countries only some of the Funds can be combined by a LAG. In Figure 2, an attempt is made to illustrate this situation with a red oval line grouping the Funds that can be combined by a LAG within a single strategy.
Figure 2: Average ESI Fund budget per LAG 2014-20, in € by Member State, and potential for combining Funds, by LAG
 Source: ESI Funds Open Data Platform and programming documents. Most recent available data. Greek data is under review.
The red ovals indicate which Funds can be combined within a single strategy, so for example: in Bulgaria and (some regions of) Germany EAFRD, ERDF and ESF can be combined but there are separate strategies for EMFF; in Portugal there are multifunded coastal FLAGs combining EMFF, ERDF and ESF, and in non-coastal areas EAFRD, ERDF and ESF can be combined; in the UK there can be strategies combining EAFRD and EMFF or combining ERDF and ESF. It should also be kept in mind that the possibility of multifunding does not necessarily mean that all the LAGs (or FLAGs) of a given MS actually combine these Funds in their strategies. In extreme cases, all four Funds can be combined (e.g. Poland) or none (e.g. Romania).
When comparing Figures 1 and 2, it is worth noting that for such countries as Cyprus, Croatia, Estonia, Latvia and Portugal, the average EMFF budget – for those LAGs that use EMFF – is actually higher than the average EAFRD budget for LAGs using this Fund. If the total budgets of these Funds are divided by the total number of LAGs in those countries, the figures for EMFF are much smaller than those for EAFRD.
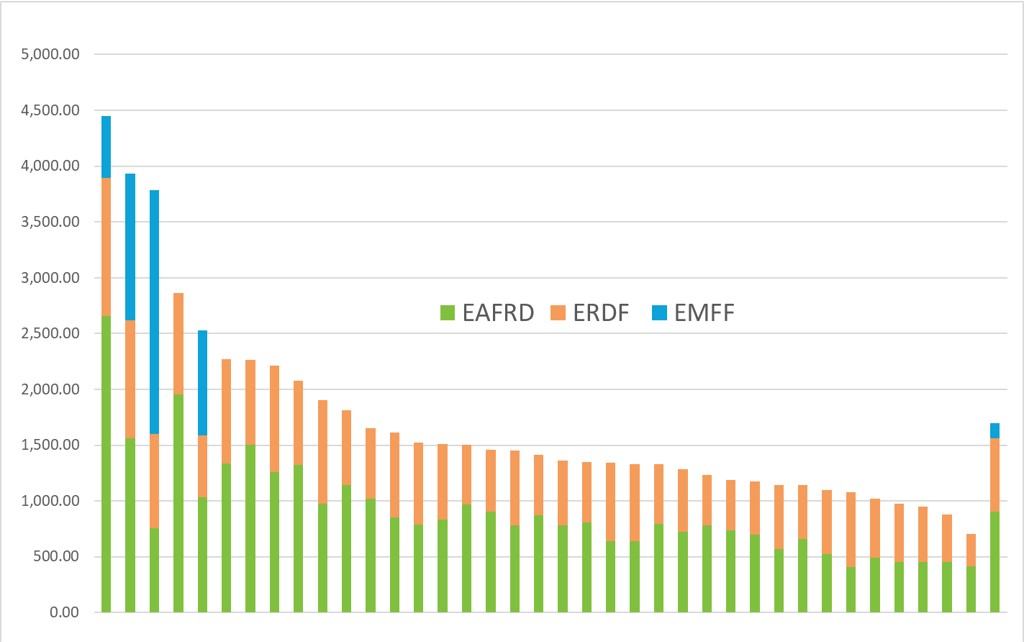
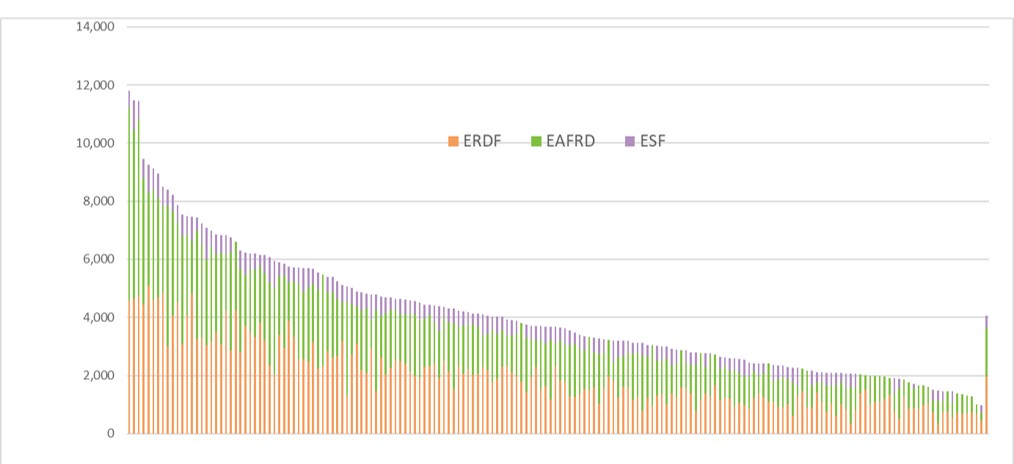
It should also be kept in mind that these figures are averages and that the range of budgets within countries can be very wide, not least depending on the size (e.g. population) of different LAGs. This is exemplified by Figures 3 and 4, which show the LAG budgets in Slovenia and Czechia, in both cases, under conditions of multi-funding.
In Slovenia, the budgets range from just under €4.5 million to a handful of LAGs with less than €1 million (the lowest budget only at €700,000). Most LAGs with very high budgets are receiving also EMFF funding in addition to EAFRD and ERDF sources. However, the vast majority of LAGs sit somewhere between €1 million and €2.5 million, with the average being €1.7 million.
Figure 3: Budgets of the 37 multi-funded LAGs in Slovenia 2014-20, by ESI Fund, in €1,000 (country average on the right)
 Source: Slovenian programme authorities
In Czechia, the smallest budget is €982,000 and the largest €11.8 million, which is over 12 times as high. The average is €4 million, which is more than twice that in Slovenia. The majority of Czech LAGs make use of three Funds (ERDF, EAFRD and ESF), but 27 LAGs do not receive any ESF funding.
Figure 4: Budgets of the 178 multi-funded LAGs in Czechia 2014-20, by ESI Fund, in €1,000 (country average on the right)
 Source: Czech programme authorities
While looking at the size of LAG budgets gives a better idea of the extent of financial CLLD resources on the ground than just national figures, there still remain unanswered questions relating to the size of LAGs within countries and, even more so, between different countries. A useful next step would be to look at CLLD funding per capita in LAG territories, but the availability of data is too heterogeneous to allow for an EU-wide overview without extensive research.
[This article is subject to final review]
Leave a Reply
You must be logged in to post a comment.